Tutorial - Designing sheets for PowerPoint reports
Subscriptions and Qlik Application Automation reports can be generated in PowerPoint format. This tutorial will show you how to use custom background images and layouts, so your sheets look professional in PowerPoint slides.
What you will learn
Once you have completed this tutorial, you will know how to design sheets that look great in PowerPoint reports. You will understand how to customize grid size and add background images to sheets.
Who should complete this tutorial
Users who are familiar with designing apps in Qlik Cloud Analytics . You know how to make charts in advanced edit mode.
What you need to do before you start
- Access to Qlik Cloud Analytics .
- User with Professional or Full User entitlement. To find out what kind of user you have, contact your tenant administrator. For more information, see Assigning user entitlements.
- Two Qlik Cloud Analytics apps. Download this package and unzip it: Tutorial - Designing PowerPoint Reports
The zip file contains two Qlik Cloud Analytics apps. Both apps already contain data and test images:
- Tester - Customer relationship management (CRM) dashboard : For users who want to complete this tutorial. This app has visualizations but the layout is unprofessional, and there are blank sheets. All the sheets in this app are set to private, so they can be edited.
- Final - Customer relationship management (CRM) dashboard : For users who want to see the final result of the tutorial. You can use this app to test subscriptions or report automations. All the sheets in this app are set to public.
Uploading the tutorial apps to the hub
Before you start, you need to upload both apps to your personal space in Qlik Cloud Analytics . Your personal space is your own private work area in the Qlik Cloud Analytics hub.
Do the following:
- Log in to Qlik Cloud Analytics .
- Click Add new > Upload . If you are using the new platform navigation experience, go to the Create page and select Upload .
- Select App .
- Drag and drop the two Qlik Cloud Analytics apps onto the dialog.
- Make sure the space is set to Personal .
- Click Upload .
Both apps are now in your personal space.
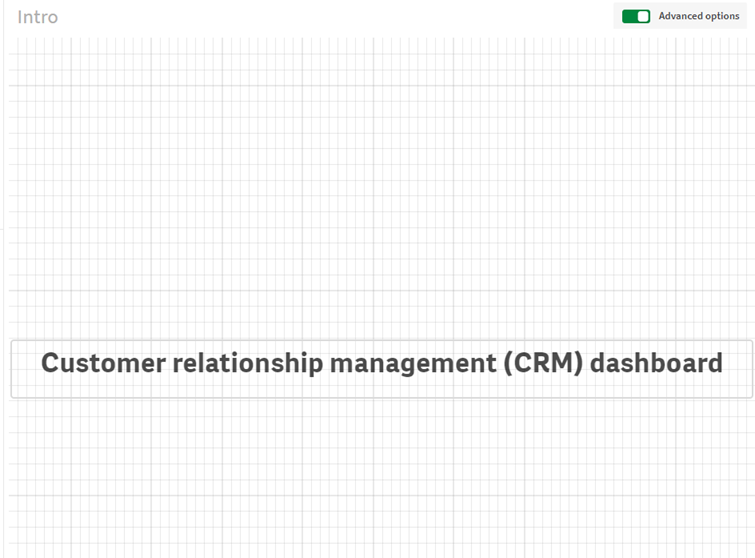
First sheet: Intro
If you want to follow along with this tutorial, open Tester - Customer relationship management (CRM) dashboard . Double-click the Intro sheet.
Information note All of the sheets in this app are set to landscape layout. Portrait layout is not supported for sheets that will be outputted to subscriptions or automations in PowerPoint format. Sheets set to portrait layout will be converted to landscape. However, you can use portrait layout if you are using the Qlik Reporting Service API . For more information about using the API to create reports, see the Developer Portal documentation.
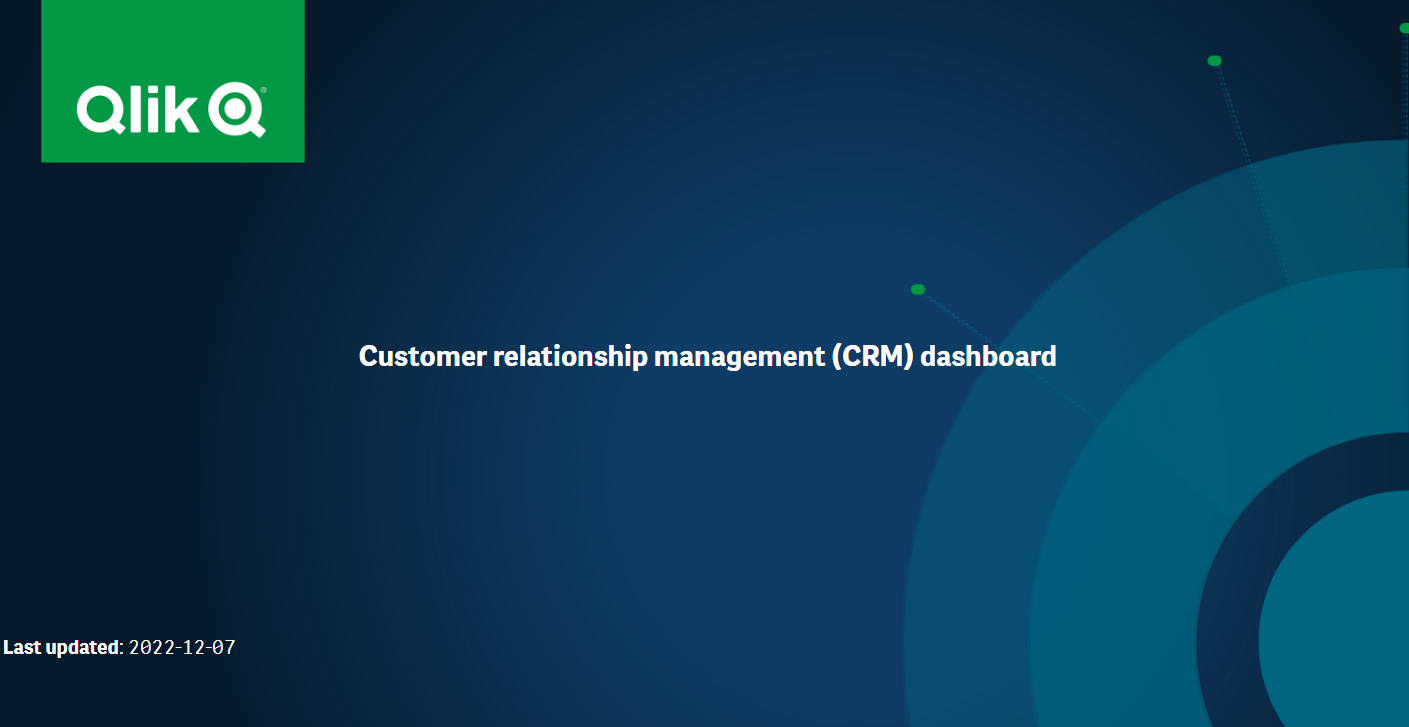
This first sheet is meant to be the title page of a PowerPoint report. Right now, it is just black text on a white background.
Do the following:
- Click Edit sheet .
- In the top right, toggle on Advanced options .
- In the properties panel, click on Styling . The sheet background settings will display.
- Under Background image , click the first drop down and select Image from media library .
- Click on the default thumbnail. The Media library opens.
- Select Q4 Title_1920_1080.png . A preview is displayed. Select Insert .
- You can change the size and orientation of the background image. For this image, select Original size and Position - top left .
- The text is too dark to read. Double-click on the text object, and change the font color to white.
- Drag a Text and image object onto the sheet. You will add an expression that shows when the app was last updated.
- In the Text and image object, type "Last updated:". Make the font color white.
- In the properties panel, click Data > Add measure . Click . The expression editor opens.
- In the expression editor, insert: =Date(now())
- Click Apply .
- The expression will change whenever the app is reloaded, to show the current date. You can format the style of the expression the same as if it was plain text. For example, make the font white or make the text larger.
The first sheet now looks like the intro slide in a PowerPoint deck. You can move to the second sheet, Trends .
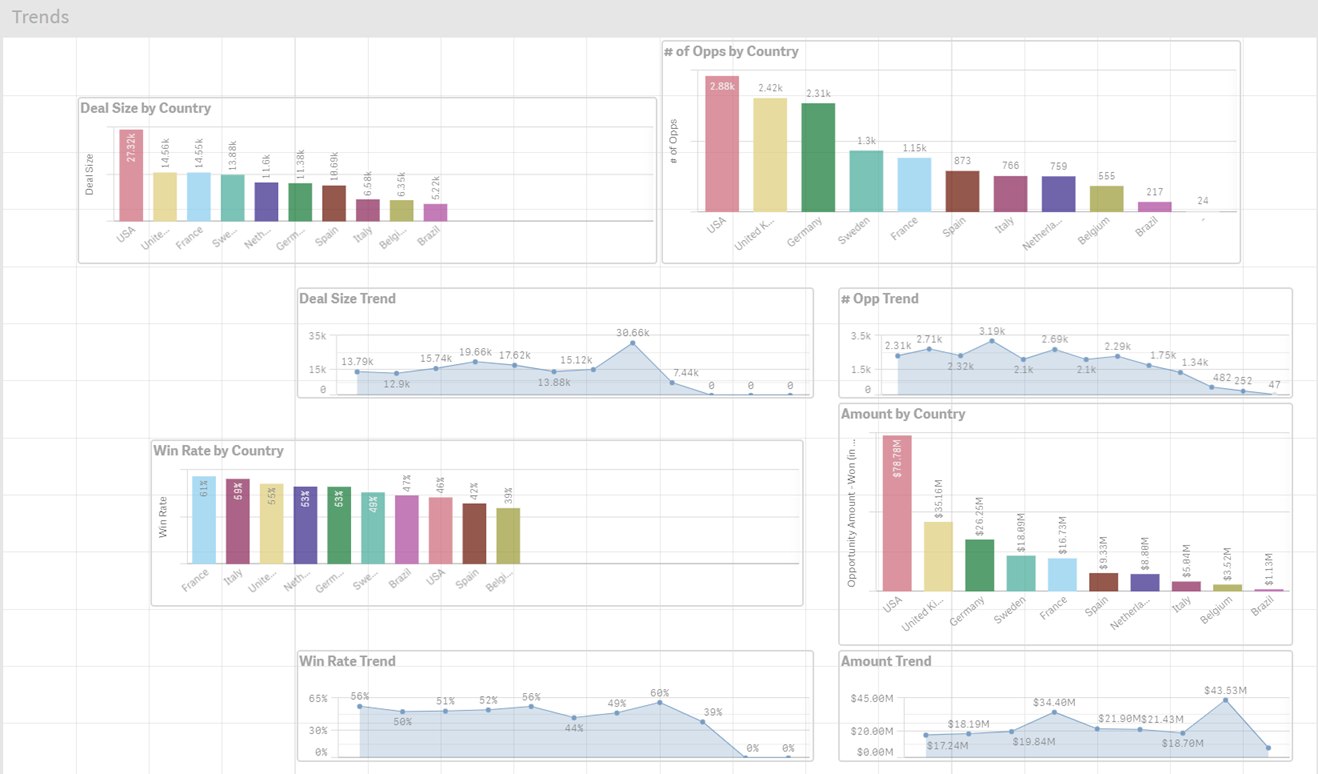
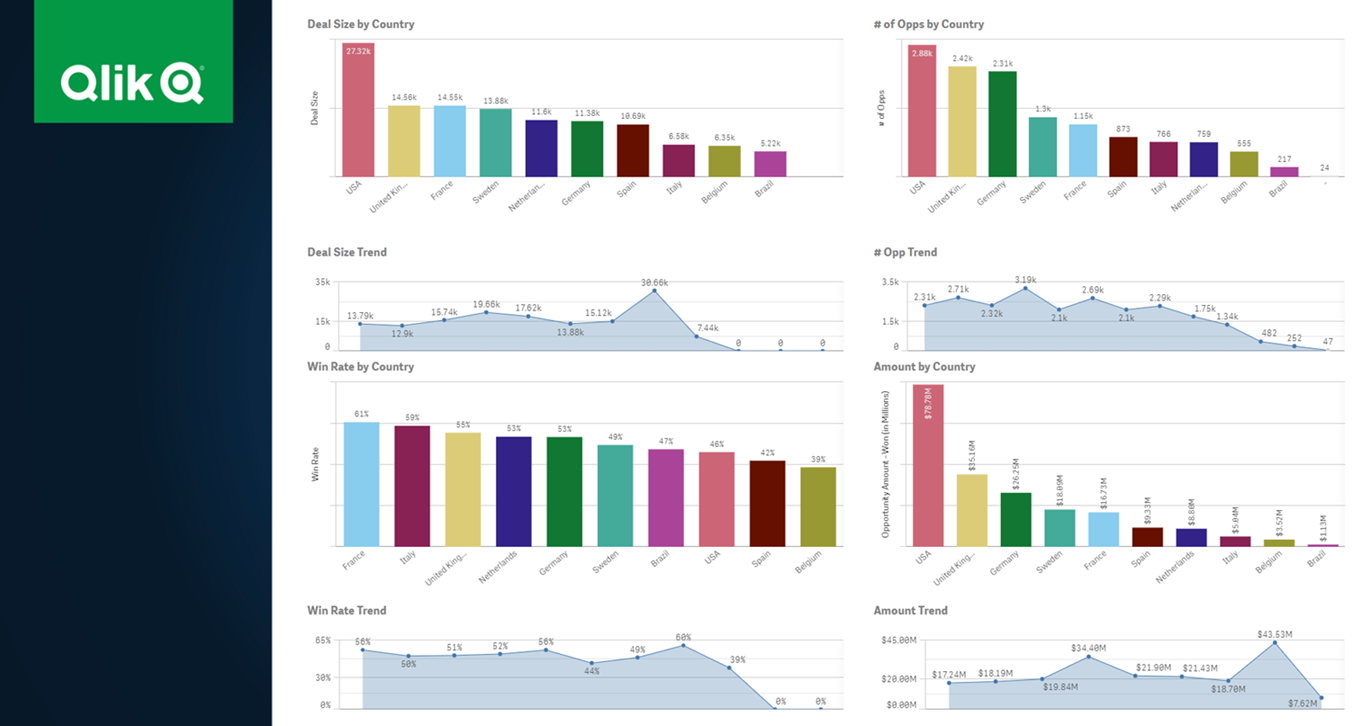
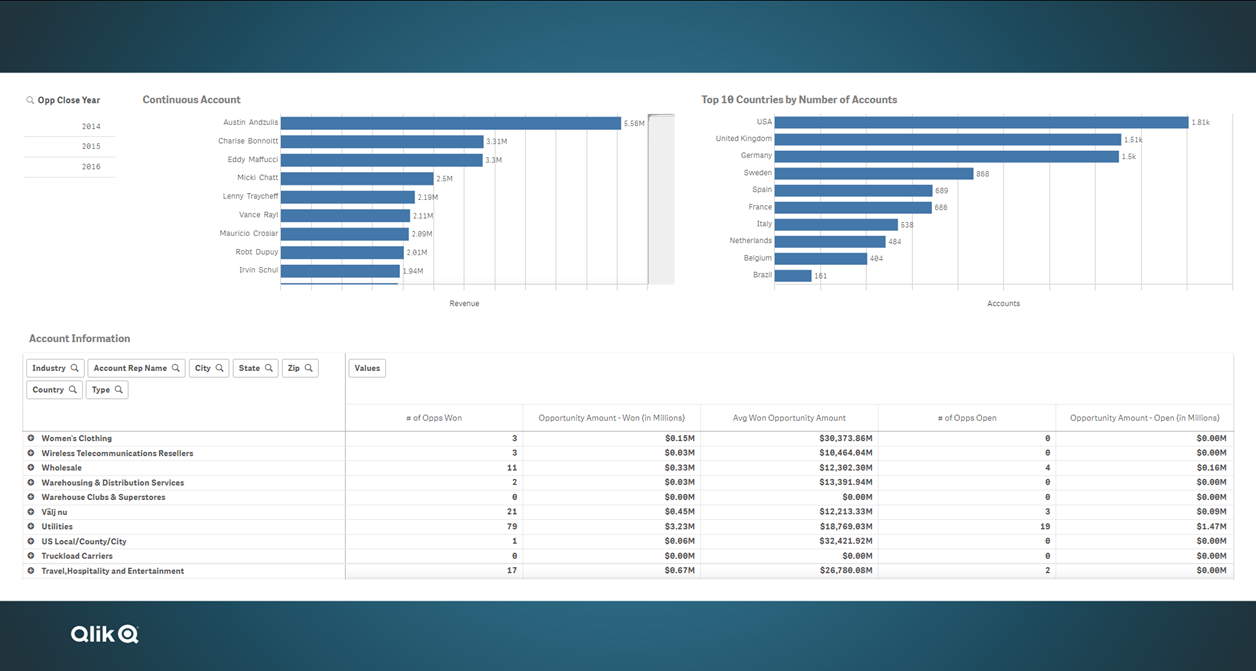
Second sheet: Trends
This sheet has some interesting charts, but they are not aligned properly. This sheet has no corporate branding.
Do the following:
- In the properties panel, click on Styling . The sheet background settings will display.
- Under Background image , click the first drop down and select Image from media library .
- Click on the default thumbnail. The Media library opens.
- Select Side Panel.png . A preview is displayed. Select Insert .
- You can change the size and orientation of the background image. For this image, select Fit to Width and Position - top left .
- Our background image is overlapping with some of the charts. Because the grid spacing is set to wide, it is difficult to align the charts properly.
- Go to Grid spacing , and select Custom in the drop down.
- Use the slider to make the grid squares as small as possible.
- Adjust the size of the charts so they line up evenly.
This sheet is now organized and has a background image set as a side panel. Move to the next sheet, Revenues .
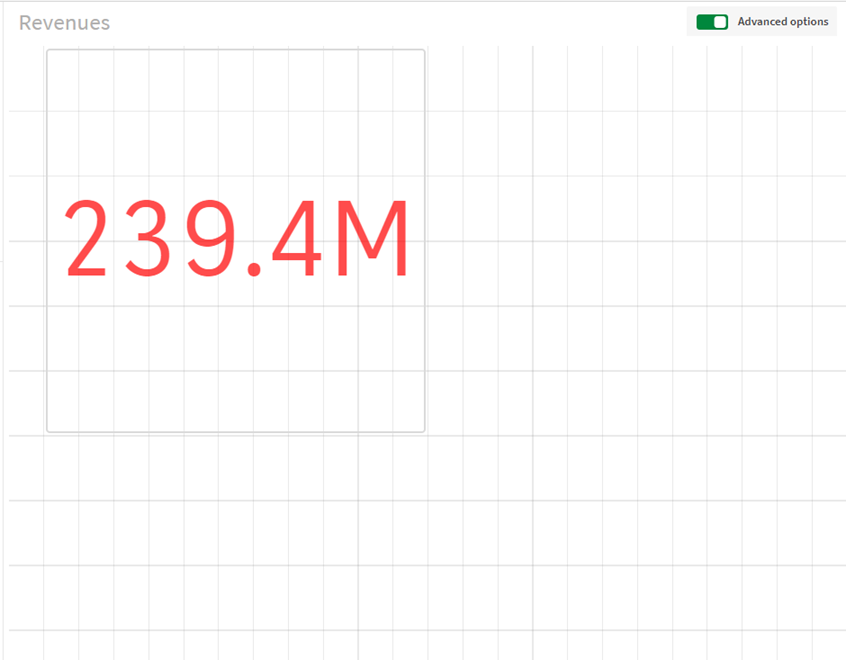
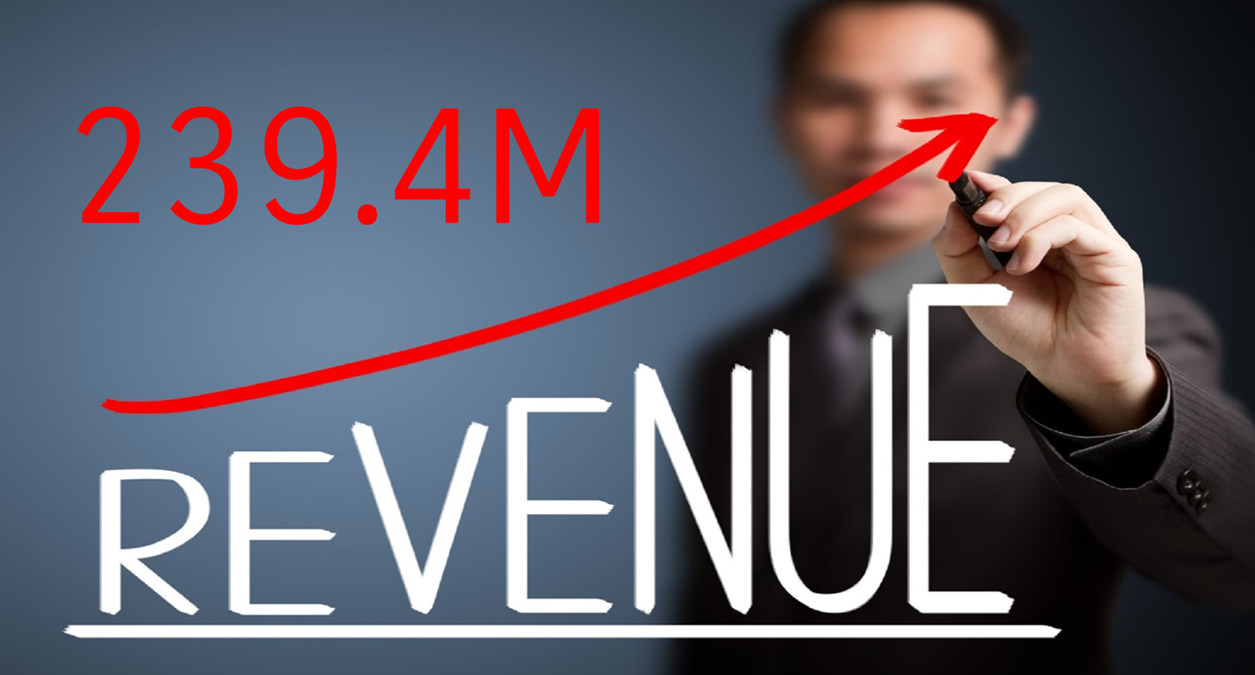
Third sheet: Revenues
This sheet has a KPI in red text displaying how much revenue has been earned. There is a lot of white space. Adding a background image will make it seem like the KPI is part of the image.
Do the following:
- In the properties panel, click on Styling . The sheet background settings will display.
- Under Background image , click the first drop down and select Image from media library .
- Click on the default thumbnail. The Media library opens.
- Select Revenue background 1980x1080.png . A preview is displayed. Select Insert .
- Change the size to Stretch to Fit .
This single KPI now has a dynamic background. Move to the next sheet, Revenue by Industry .
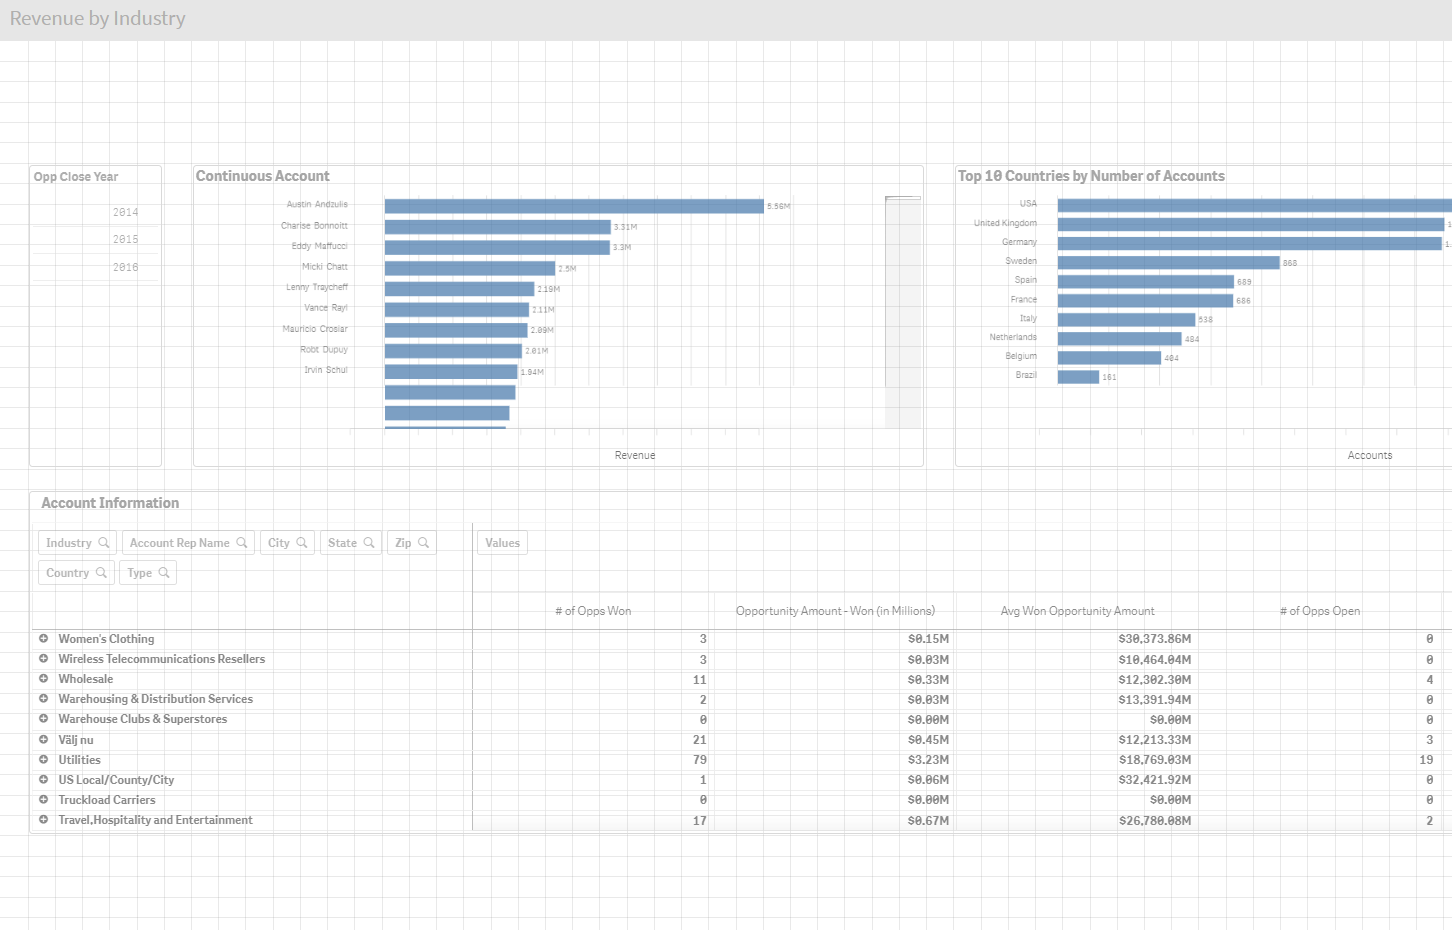
Fourth sheet: Revenue by Industry
This sheet has several charts, but a lot of white space. Let's add an image as a border.
Do the following:
- In the properties panel, click on Styling . The sheet background settings will display.
- Under Background image , click the first drop down and select Image from media library .
- Click on the default thumbnail. The Media library opens.
- Select Q4 Background Slide_1920_1080.png . A preview is displayed. Select Insert .
- Change the size to Stretch to Fit .
The sheet now has a bar of color on the top and bottom. Move to the next sheet, The end .
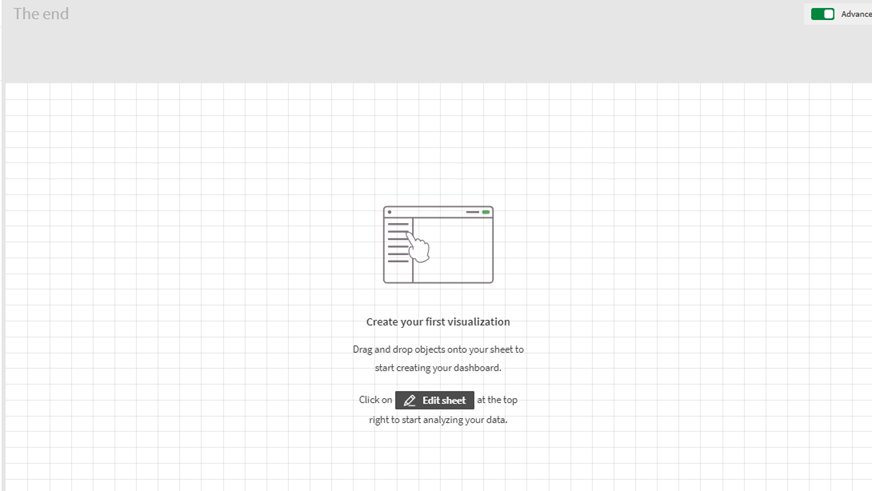
Fifth sheet: The end
This sheet is meant to let the audience know that the PowerPoint presentation is over. Right now it is blank. You will add an animated .gif as a background image.
Do the following:
- In the properties panel, click on Styling . The sheet background settings will display.
- Under Background image , click the first drop down and select Image from media library .
- Click on the default thumbnail. The Media library opens.
- Select Qlik_Outro_Presentation.gif . A preview is displayed. Select Insert .
- Change the size to Always fill and Position - top left .
The sheet now has a large animation. The .gif will be animated in the sheet or a PowerPoint report, but not in a PDF.
Move to the next sheet, Thank you .
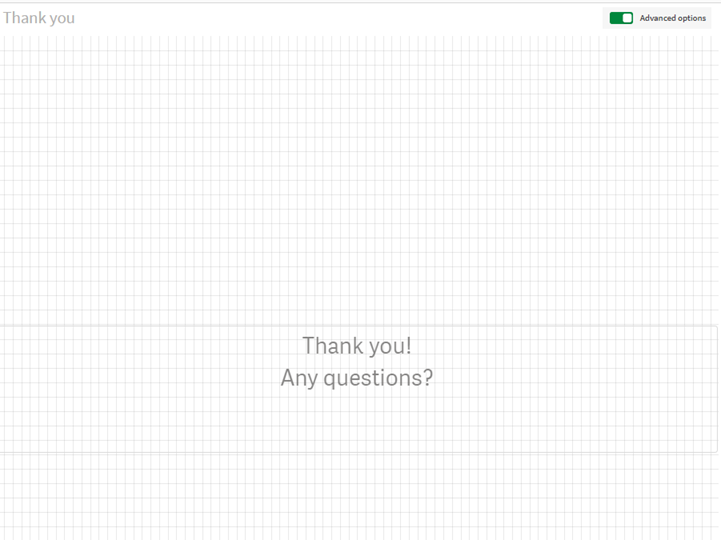
Sixth sheet: Thank you
This sheet is meant to let the audience know they can ask questions. Right now it is black text on a white background. You will add the same background image used in the first sheet. This way, the first and last PowerPoint slides have the same image.
Do the following:
- In the properties panel, click on Styling . The sheet background settings will display.
- Under Background image , click the first drop down and select Image from media library .
- Click on the default thumbnail. The Media library opens.
- Select Q4 Title_1920_1080.png . A preview is displayed. Select Insert .
- You can change the size and orientation of the background image. For this image, select Original size and Position - top left .
- The text is too dark to read. Double-click on the text object, and change the font color to white.
You now have six sheets that look like a professional PowerPoint deck. Click Edit sheet to stop editing.
Next steps
Your app is now ready to be added to a subscription or report automation.
Subscriptions are a good choice if you need to apply section access to your reports. For more information, see Scheduling reports with subscriptions.
Reporting automations allow you to created more complex reports, such as reports with looping. For more information, see Creating a report using Qlik Application Automation.
If you are creating an automated report that will run on a schedule, you should make sure your app data is also reloading on a schedule. For more information, see Reloading app data.
Sheet
Sheets are components of Qlik Sense apps. They present visualizations to app users so they can explore, analyze, and discover data. Sheets can be public or private.
Similar terms : Dashboard, worksheet
App
This term has several definitions:
- A Qlik Sense or QlikView app: Apps are task-specific, purpose-built applications. Apps contain data loaded from data sources that is interpreted through visualizations. Similar terms : Document, workbook See : Understanding apps
- The Qlik Sense Mobile app: A mobile app for iOS and Android devices. In the mobile app, you connect to and interact with your cloud data. You can work with your available apps. See : Qlik Sense Mobile SaaS
Chart
Charts are objects where calculations, aggregations, and groupings can be made. Graphical visualizations, such as bar charts and pie charts are common examples, but also non-graphical objects such as pivot tables are charts.
A chart consists of dimensions and measures, where the measures are calculated once per dimensional value. If the chart contains multiple dimensions, the measures are calculated once per combination of dimensional values.
Similar terms : Visualization, Hypercube, Cube
Visualization
Visualizations are charts, extensions, and other objects that visualize your data for exploration in a sheet.
Similar terms : Chart
Space, personal
A personal space is a private space belonging to users where they can develop apps.
Hub
The hub is the central point of access for apps, spaces, and collections.
Similar terms : Access point
Subscription
Subscription reports let you schedule recurring emails containing a PDF of your selected sheets or charts.
